Gold Trading Signals Strategic Analysis
Master gold trading signals with strategic insights for XAUUSD success.
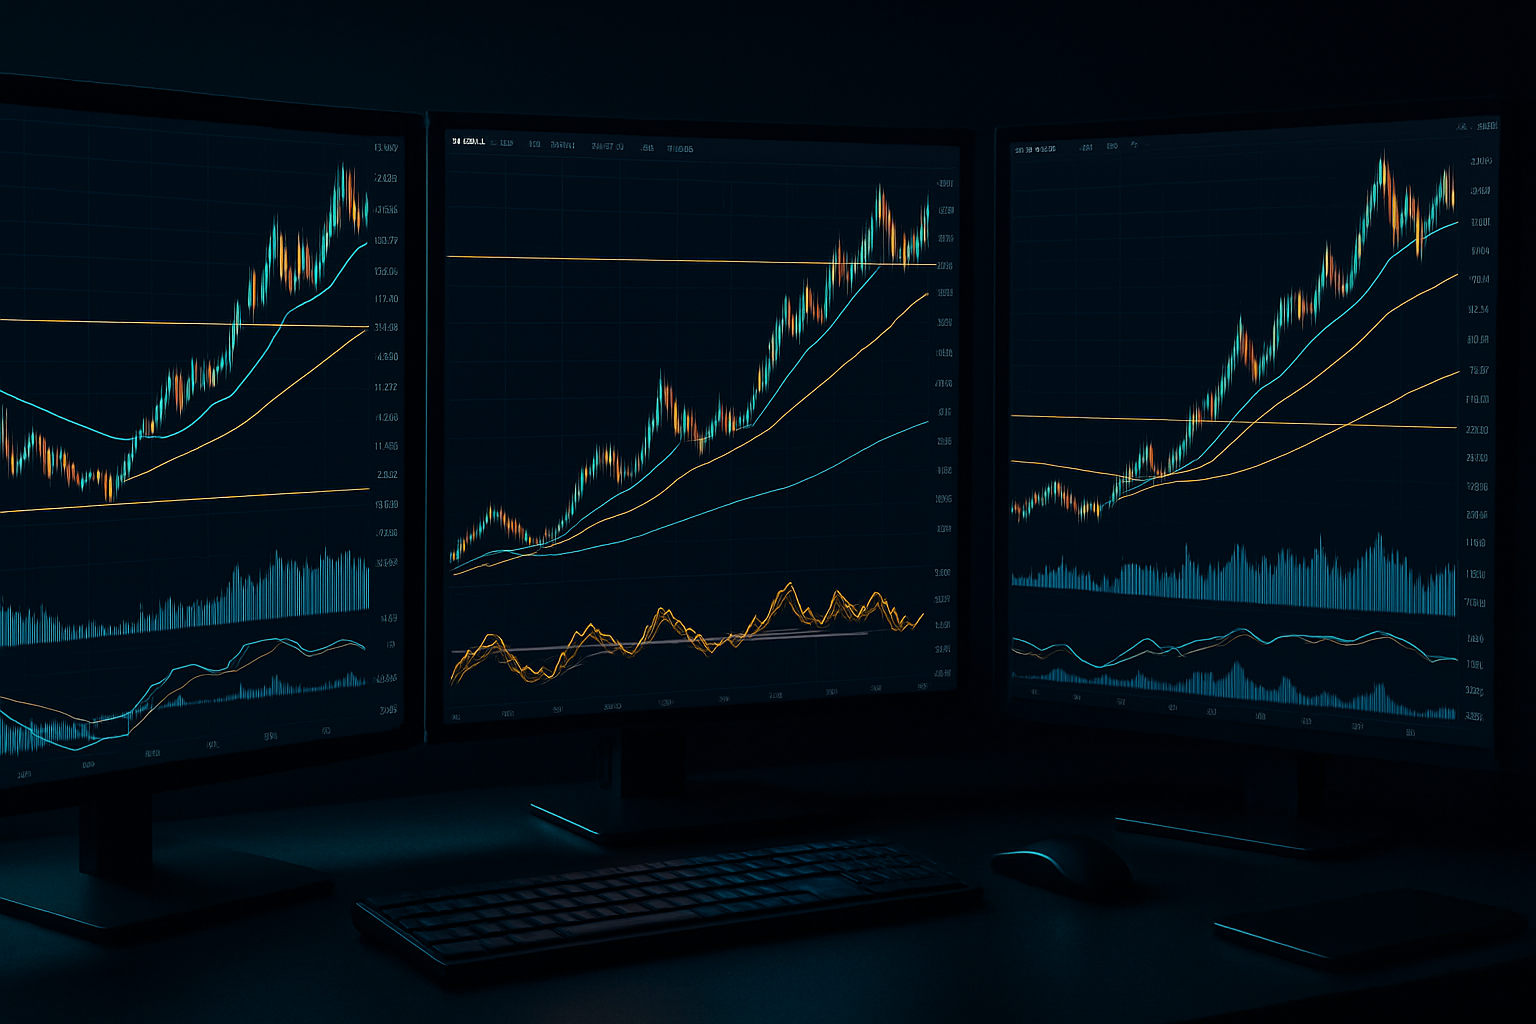
Signal Identification Methodologies
Strategic signal identification forms the foundation of successful gold trading operations. Technical indicators like RSI, moving average crossovers, and Elliott Wave patterns generate specific entry signals when combined with proper market context analysis. Our MetaTrader platforms offer over 50 built-in indicators, allowing traders to customize signal detection systems according to their strategic preferences. The most effective signals emerge from confluence zones where multiple technical factors align, creating high-probability trading scenarios with favorable risk-reward ratios.
RSI divergence signals occur when price action contradicts momentum readings, indicating potential trend reversals in XAUUSD markets. When gold prices reach new highs while RSI shows lower peaks, bearish divergence suggests selling opportunities with stops placed above recent highs. Conversely, bullish divergence appears when prices make lower lows while RSI maintains higher lows, signaling potential buying opportunities. These signals work best on 4-hour and daily timeframes, providing sufficient market context for strategic positioning decisions.
Moving average crossover systems generate clear buy and sell signals through systematic trend identification. The 9-period Simple Moving Average crossing above the 20-period Exponential Moving Average creates bullish signals, while opposite crossovers indicate bearish conditions. Our platform’s one-click trading feature enables immediate signal execution, reducing slippage during volatile market conditions. Traders should confirm crossover signals with additional technical factors like support/resistance levels and candlestick patterns for enhanced accuracy.
Exness Signal Integration Tools
Our trading platform integrates signal detection with automated execution capabilities through Expert Advisors and custom indicators. These tools monitor multiple timeframes simultaneously, alerting traders to signal developments across different market contexts. The platform’s notification system sends real-time alerts to mobile devices, ensuring signal opportunities aren’t missed during active trading sessions.
Technical Analysis Framework Strategies
Comprehensive technical analysis provides the strategic backbone for interpreting gold trading signals effectively. Elliott Wave theory identifies market cycles through impulsive and corrective wave sequences, offering predictive insights into future price movements. Five-wave impulsive sequences indicate strong trending conditions, while three-wave corrections suggest temporary pullbacks within larger trends. Our charting tools display wave counts automatically, helping traders identify their position within current market cycles for strategic planning purposes.
Support and resistance levels create natural signal zones where price reactions typically occur with higher probability. Historical price levels where gold previously reversed direction become future reference points for signal validation and trade management. When signals develop near established support or resistance zones, they carry additional weight due to institutional order flow concentrations. Our platform’s drawing tools enable precise level identification across multiple timeframes, supporting comprehensive market analysis.
Candlestick pattern recognition enhances signal quality through price action confirmation techniques. Pin bars, engulfing patterns, and inside bars provide visual confirmation of market sentiment shifts at critical price levels. These patterns work synergistically with technical indicators, creating robust signal combinations with clearly defined risk parameters. The platform’s pattern recognition features automatically identify significant formations, streamlining the analysis process for busy traders.
Dollar Index correlation analysis adds fundamental context to gold trading signals. When DXY breaks key support or resistance levels, corresponding gold movements often follow with predictable timing. Strong dollar rallies typically pressure gold prices lower, while dollar weakness supports gold advances. Our economic calendar integration highlights DXY-related events, enabling proactive signal preparation based on fundamental catalysts.
| Strategy Type | Primary Indicators | Timeframe Focus | Signal Strength |
|---|---|---|---|
| Elliott Wave | Wave counts, RSI divergence | Daily, 4-hour | High probability cycles |
| MA Crossover | SMA 9, EMA 20 | 4-hour, 1-hour | Trend confirmation |
| Support/Resistance | Historical levels, volume | All timeframes | Price reaction zones |
| Candlestick Patterns | Pin bars, engulfing | 4-hour, daily | Sentiment confirmation |
Risk Management Integration Methods
Strategic risk management transforms trading signals from gambling propositions into calculated business decisions. Position sizing based on account equity percentages ensures consistent risk exposure regardless of signal frequency or market volatility. Our platform’s position size calculator automatically determines appropriate lot sizes based on predefined risk parameters, eliminating emotional decision-making during signal execution. The recommended risk per trade ranges from 1-2% of total account equity, providing sustainable growth potential while preserving capital during inevitable losing streaks.
Stop-loss placement strategies utilize technical analysis principles to define maximum acceptable losses per signal. Average True Range (ATR) measurements provide volatility-adjusted stop distances, preventing premature exits during normal market fluctuations. Placing stops one ATR below support levels for long positions, or one ATR above resistance for short positions, balances protection with market breathing room. Our trailing stop functionality automatically adjusts stop levels as positions move favorably, locking in profits while maintaining trend exposure.
Take-profit targeting employs multiple exit strategies to optimize signal profitability. Initial targets set at 2-3 times the risk amount create favorable risk-reward ratios, while partial profit-taking at key resistance levels secures gains during extended moves. The platform’s multiple order functionality enables sophisticated exit strategies, including scaling out at predetermined levels while maintaining core positions for trend continuation. This approach maximizes signal profitability while managing the psychological challenges of profit-taking decisions.
Trade management protocols define systematic approaches to signal monitoring and adjustment. Moving stops to breakeven after achieving 1:1 reward eliminates downside risk while maintaining upside potential. Position scaling techniques add to winning trades at predetermined levels, amplifying profitable signals while maintaining disciplined risk control. Our platform’s trade modification features enable real-time adjustments without closing existing positions, supporting dynamic trade management strategies.
Exness Risk Control Features
Our platform’s negative balance protection prevents losses exceeding account deposits, providing essential safety nets for leveraged gold trading. Margin call alerts at 60% equity levels provide early warnings before automatic position closure, enabling proactive risk management decisions. The integrated risk calculator displays real-time exposure across all open positions, supporting comprehensive portfolio risk assessment.
Market Context Analysis Approaches
Understanding broader market context elevates signal interpretation from mechanical rule-following to strategic market analysis. Fundamental factors like central bank policies, inflation data, and geopolitical events create underlying trends that influence signal effectiveness. Federal Reserve interest rate decisions particularly impact gold prices through real yield calculations, making signals more reliable when aligned with fundamental trends. Our economic calendar integration provides advance notice of market-moving events, enabling strategic signal timing around high-impact announcements.
Intermarket analysis examines relationships between gold, currencies, bonds, and equity markets to validate signal quality. Strong equity market performance often coincides with gold weakness as investors favor risk assets over safe havens. Conversely, market stress periods typically support gold advances regardless of technical signal direction. Our multi-asset charting capabilities enable simultaneous analysis of correlated markets, providing comprehensive context for signal evaluation and timing decisions.
Seasonal patterns influence gold price behavior through predictable supply and demand cycles. Indian wedding seasons and Chinese New Year celebrations create recurring demand spikes, while summer months often see reduced jewelry consumption. These patterns provide strategic context for signal timing, with trend-following signals gaining additional strength during seasonally supportive periods. Historical analysis tools within our platform identify recurring seasonal tendencies, supporting long-term strategic planning efforts.
Market sentiment indicators like the VIX and gold ETF flows provide additional signal confirmation through institutional positioning data. Rising volatility typically supports gold demand as portfolio hedging increases, while declining volatility often pressures precious metals. ETF flow data reveals institutional sentiment shifts before they appear in price action, providing early signal validation opportunities. Our sentiment analysis tools aggregate multiple indicators into comprehensive market mood assessments.
Signal Timing Optimization Techniques
Precise signal timing separates profitable traders from those who struggle with identical information sources. London and New York session overlaps create optimal liquidity conditions for signal execution, reducing slippage and improving fill quality. Our platform’s session indicator highlights active trading periods, enabling strategic timing decisions based on market participation levels. Avoiding signal execution during low-liquidity Asian sessions prevents poor fills and unexpected price gaps that can invalidate carefully planned trades.
News event timing requires strategic coordination between signal generation and fundamental announcements. High-impact events like Non-Farm Payrolls and CPI releases create significant volatility that can trigger stops or accelerate profitable moves. Successful traders either avoid signals immediately before major announcements or position specifically for event-driven volatility. Our economic calendar integration provides countdown timers and impact ratings, supporting informed timing decisions around scheduled events.
Multiple timeframe analysis ensures signal timing aligns with broader trend contexts. Signals generated on shorter timeframes gain reliability when confirmed by longer-term trend direction and momentum. A 4-hour bullish signal carries more weight when daily and weekly charts show upward trends, while counter-trend signals require additional confirmation factors. Our synchronized charting displays multiple timeframes simultaneously, streamlining comprehensive timing analysis for busy traders.
Volatility-based timing adjusts signal execution to current market conditions. High volatility periods offer larger profit potential but require wider stops and more aggressive position sizing adjustments. Low volatility environments provide more predictable price action but limit profit targets and require tighter risk management. The platform’s volatility indicators automatically adjust to current market conditions, providing dynamic timing guidance for signal execution decisions.
Exness Execution Advantages
Our ultra-fast execution speeds minimize slippage during critical signal timing moments, ensuring planned entries occur at intended price levels. The platform’s no-requote policy eliminates execution delays during volatile periods, supporting precise timing strategies. Advanced order types including stop-limit orders provide additional timing control for complex signal execution scenarios.
Performance Tracking and Analysis Systems
Systematic performance tracking transforms signal trading from intuitive guesswork into data-driven strategy optimization. Trade journaling captures essential details including signal source, entry/exit prices, market conditions, and emotional state during execution. Our platform’s built-in trade history provides comprehensive records, but external journaling adds qualitative insights that pure data cannot capture. Regular journal reviews identify patterns in both winning and losing trades, revealing strategic adjustments that improve overall performance metrics.
Statistical analysis quantifies signal performance through key metrics including win rate, average risk-reward ratio, maximum drawdown, and profit factor calculations. Win rates above 40% combined with risk-reward ratios exceeding 1:2 typically produce profitable results over extended periods. Our reporting tools automatically calculate these metrics, providing objective performance assessments without manual calculation requirements. Monthly and quarterly reviews identify performance trends and highlight areas requiring strategic adjustment or additional education focus.
Signal source evaluation compares performance across different providers and methodologies. Some signals excel during trending markets while others perform better in ranging conditions, requiring strategic allocation based on current market characteristics. Tracking individual signal performance enables portfolio-style approaches where multiple sources complement each other’s strengths and weaknesses. The platform’s custom indicator capabilities support simultaneous testing of multiple signal systems within unified trading environments.
Drawdown analysis examines losing streak characteristics to ensure risk management systems remain effective during challenging periods. Maximum consecutive losses and peak-to-trough equity declines reveal system robustness under adverse conditions. Successful signal trading requires surviving inevitable drawdown periods while maintaining confidence in proven methodologies. Our equity curve analysis tools visualize performance patterns, helping traders maintain psychological discipline during temporary setbacks.
| Performance Metric | Target Range | Calculation Method | Strategic Importance |
|---|---|---|---|
| Win Rate | 40-60% | Winning trades / Total trades | Signal reliability |
| Risk-Reward Ratio | 1:2 minimum | Average win / Average loss | Profitability potential |
| Maximum Drawdown | <20% equity | Peak to trough decline | Risk tolerance |
| Profit Factor | >1.3 | Gross profit / Gross loss | Overall effectiveness |
Advanced Signal Interpretation Strategies
Professional signal interpretation requires understanding market microstructure and institutional behavior patterns. Large institutional orders create price levels where signals gain additional significance through order flow concentration. These levels often coincide with round numbers, previous day highs/lows, and weekly pivot points where algorithmic trading systems concentrate activity. Our Level II data integration reveals order book depth, providing insights into potential signal strength based on underlying liquidity conditions.
Multi-asset signal confirmation enhances individual XAUUSD signals through correlated market analysis. Currency pair correlations, particularly EUR/USD and USD/CHF relationships with gold, provide additional signal validation opportunities. When multiple correlated assets generate similar signals simultaneously, probability of success increases significantly compared to isolated single-asset signals. Our correlation analysis tools automatically identify related market movements, streamlining multi-asset signal interpretation processes.
Algorithmic signal filtering removes low-quality opportunities through systematic screening criteria. Minimum volatility requirements ensure adequate profit potential, while maximum volatility thresholds prevent excessive risk exposure. Time-based filters avoid signals during low-liquidity periods or immediately before major announcements. Our Expert Advisor capabilities enable automated signal filtering based on predetermined criteria, reducing manual analysis workload while maintaining strategic consistency.
Signal combination strategies merge multiple methodologies into comprehensive trading approaches. Elliott Wave analysis provides long-term directional bias, while shorter-term indicators generate specific entry timing within established trends. Combining trend-following signals with mean-reversion techniques creates balanced approaches suitable for various market conditions. The platform’s custom indicator development supports sophisticated signal combination strategies tailored to individual trading preferences and risk tolerance levels.
Professional traders develop signal hierarchies that prioritize opportunities based on probability and profit potential. High-confidence signals receive larger position sizes and longer holding periods, while lower-probability setups warrant smaller risks and quicker profit-taking. This approach optimizes capital allocation across varying signal qualities, maximizing returns while maintaining consistent risk management principles. Our position sizing tools support dynamic allocation strategies based on signal confidence levels and current market conditions.
❓ FAQ
What are gold trading signals?
Gold trading signals are systematic alerts generated using technical and fundamental analysis to indicate optimal entry and exit points for trading XAUUSD.
How does Exness support signal execution?
Exness provides advanced platforms with integrated Expert Advisors, custom indicators, real-time notifications, and ultra-fast execution to enhance signal accuracy and trading efficiency.
Why is risk management important in gold trading?
Risk management ensures traders protect their capital by defining position sizes, stop-loss levels, and take-profit targets, transforming signals into calculated business decisions.
Can fundamental factors affect gold signal reliability?
Yes, fundamental events like central bank policies and dollar index movements influence gold prices, making signals more reliable when aligned with these broader market trends.
How can I improve signal timing?
Optimizing signal timing involves using session overlaps, avoiding low liquidity periods, coordinating with news events, multiple timeframe confirmation, and volatility-based adjustments.